
How I Find Winning Dropshipping Products for 2026 (100% FREE Method)
Most drop shippers burn through dozens of products and wonder why nothing sticks. The difference between constant losses and repeated winners comes down to two things: choosing the right product and using data-driven ways to find it. Below is a concise, no-fluff system that I use to add winning products to seven-figure stores in 2026. It covers the exact product criteria you should use and three untapped, verifiable research methods you can run for free or via short trials.
What makes a winning product in 2026
Ad costs, supplier costs, and customer expectations have shifted. The old $10–$30 wins are mostly gone. Use these criteria as a filter before you ever spend ad money:
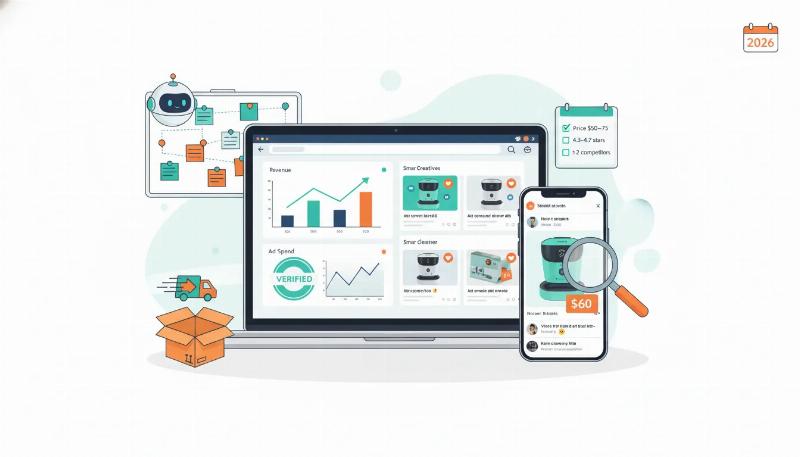
- Price range: Aim for $50–$75. Higher ticket gives room to spend on ads while protecting margin.
- Healthy margin: Calculate product cost + shipping. You want enough margin to comfortably spend on customer acquisition (example below).
- Market gap capitalization: A product that’s good but badly marketed, or one you can reposition for a specific audience (parents, pet owners, students, gyms), gives more angles and virality potential.
- Only 1–2 real competitors running active ads: This proves demand without heavy saturation.
- Active ads with strong engagement: Look for recent ads with real comments and engagement, not old or inactive creatives.
- Solid social proof: Target products with ratings around 4.3–4.7 stars. Avoid widely panned products that will create refunds and chargebacks.
Why the $50–$75 range matters
Example math: sell at $60, product cost (all-in) $8 = $52 gross margin. That margin lets you comfortably spend $30–$40 acquiring a customer and still be profitable. That breathing room is essential for meaningful, confident testing on platforms like Facebook and TikTok.
Method 1 — Reverse-engineer verified stores (trust.com)
Use a verification directory that brands connect to for credibility. These platforms often publish real ad spend and ROAS data when stores link ad accounts. Reverse-engineer successful sellers and then trace their active ad creatives.
- Filter entries by Type: store and pick brands with clear names.
- Open a brand profile and check verified metrics like total ad spend and recent ROAS. Verified ad accounts = real data, not guesses.
- Copy the brand name, search it in Google, open the brand website, and find their social channels.
- Use the Facebook Ad Library and filter for active ads. Look for which product they run most ads to (ad volume = winning product indicator).
- Image-search the product on AliExpress to find similar SKUs. AliExpress can show a low price but shipping quality/times is unreliable.
- For better sourcing, use a professional dropshipping supplier that offers faster fulfillment, warehousing, and vetted suppliers to cut out middlemen. Ask them to source the exact SKU if needed.
Why this works: you’re looking at stores that have connected their real ad accounts. You get confirmed demand signals and ad creatives you can study, then find a trustworthy supplier to source a similar product.
Method 2 — Trend + revenue signals (app.practical.com + Winning Hunter)
Use trend databases that aggregate real revenue and product-level signals from DTC brands. These tools show market size, top brands, price ranges, and product-level revenue—data you can verify.
- Search trending categories (for example “charms”) and view estimated market size and year-over-year growth.
- Open brand leaderboards to see which companies dominate and which SKUs generate revenue.
- Drill into a brand’s product pages to see sales over time, reviews, sentiment, and sell-through rates.
- Use a Chrome extension that surfaces a brand’s active ads and bestselling products directly from the brand page so you can see creatives without separately visiting the ad library.
Tips:
- Big DTC brands often dominate these databases. Instead of competing head-on, use AI to find gaps they’re not covering or angles they ignore.
- Cross-reference any promising SKU with suppliers and compare price vs. the brand’s retail price to calculate margin for ad testing.
- Use the trial option on paid tools to extract trend and product data—then cancel if you don’t need a subscription long-term.
Method 3 — Agentic AI research (GenSpark + Miro board prompts)
Let an AI agent perform multi-step research tasks for you: identify problem-solving products in a niche, verify competitors and ads, and produce a short list that meets your product criteria.
- Use a prebuilt prompt that instructs the agent to search for product ideas that match your filters (price, reviews, ad presence, market gap).
- Run the agent in a targeted niche (example below uses the dog niche). Let it crawl ad libraries, product pages, and marketplaces to assemble validated picks.
- Review the agent’s deliverable, which should include why each product is a match and any competitor analysis.
Example output (dog niche):
- Six-speed dog nail grinder. Solves fear and difficulty of traditional nail clipping; less stress for pets and owners.
- Inflatable post-surgery collar. More comfortable than plastic cones; solves a widespread pain point after vet procedures.
- Automatic pet paw cleaner. Cleans paws with less effort than manual cups—convenience-focused alternative to manual cleaners.
Market validation summary for the automatic paw cleaner (example)
- Competitors sell solutions to the same pain point, but mostly manual versions.
- Existing demand is visible, yet few offer the automatic mechanism—this is a gap to exploit.
- Key insight: customers prefer convenience. A product that reduces effort has proven psychological advantage.
- Find suppliers with good reviews and shipping options, then position the product against manual alternatives.
How to validate quickly before scaling tests
- Check active ads: Active creatives with comments are stronger proof than archived examples.
- Confirm social proof: 4.3–4.7 star range indicates a product that satisfies customers without being overpriced.
- Calculate ad budget tolerance: Example: $60 price minus $8 cost leaves $52—this supports a $30–$40 CAC test budget.
- Don’t copy the same angle: If a competitor uses “one angle,” find different audiences or use different messaging to avoid direct ad wars.
- Source with quality in mind: Faster shipping and better quality reduce refunds. Avoid sourcing purely on price.
Practical testing workflow
- Run product through the criteria filter above.
- Verify demand via active ads and verified ad spend signals.
- Find supplier options and confirm shipping times and sample quality.
- Build 3–5 creatives targeting different angles/audiences for the same product.
- Launch low-budget tests across Facebook and TikTok. Monitor CAC vs. target range.
- If CAC <= your target range and ROAS looks promising, scale gradually and add more creatives and retargeting funnels.
Final checklist before you spend ad dollars
- Product price in the $50–$75 range
- Clear margin to support a sensible CAC
- 1–2 competitors running active ads (not 0, not saturated)
- Ads show good engagement and recent activity
- Product ratings in the 4.3–4.7 range
- Supplier options with fast, reliable shipping and good sample reviews
- At least two different marketing angles ready for testing
Finding winners in 2026 is about using verified signals, exploiting market gaps, and testing with margin. Use the three methods above—reverse-engineering verified stores, mining trend-plus-revenue platforms, and automating deep research with agentic AI—and you’ll dramatically reduce wasted tests and increase your hit rate.
Iterate quickly, protect margin, and focus relentlessly on positioning and creative. That’s the repeatable way to turn a product into a real, scalable winner.